

// Tableau data apps
Web apps that run inside Tableau, on your data.
A data app lives in the workbook and draws whatever it likes from the worksheet it sits on. Put the answer where people already look: how fresh the numbers are, which refreshes are behind, what your site is doing.
Packaged in the workbook
The app ships inside the .twbx. Nothing to host, no server to keep up, no URL to allow-list, and no permission prompt for viewers.
Draws from the sheet's data
It reads the rows of the worksheet it sits on, so it follows the same data source, the same filters and the same permissions as the rest of the dashboard.
Anything a web page can do
Charts Tableau can't draw, live status strips, games, sound, 3D. If it runs in a browser, it can run on a Tableau dashboard.
// For Tableau admins
Tell every viewer whether to trust the dashboard.
Built on the refresh and usage data your site already keeps. Each one opens here in your browser on a bundled copy of its data.
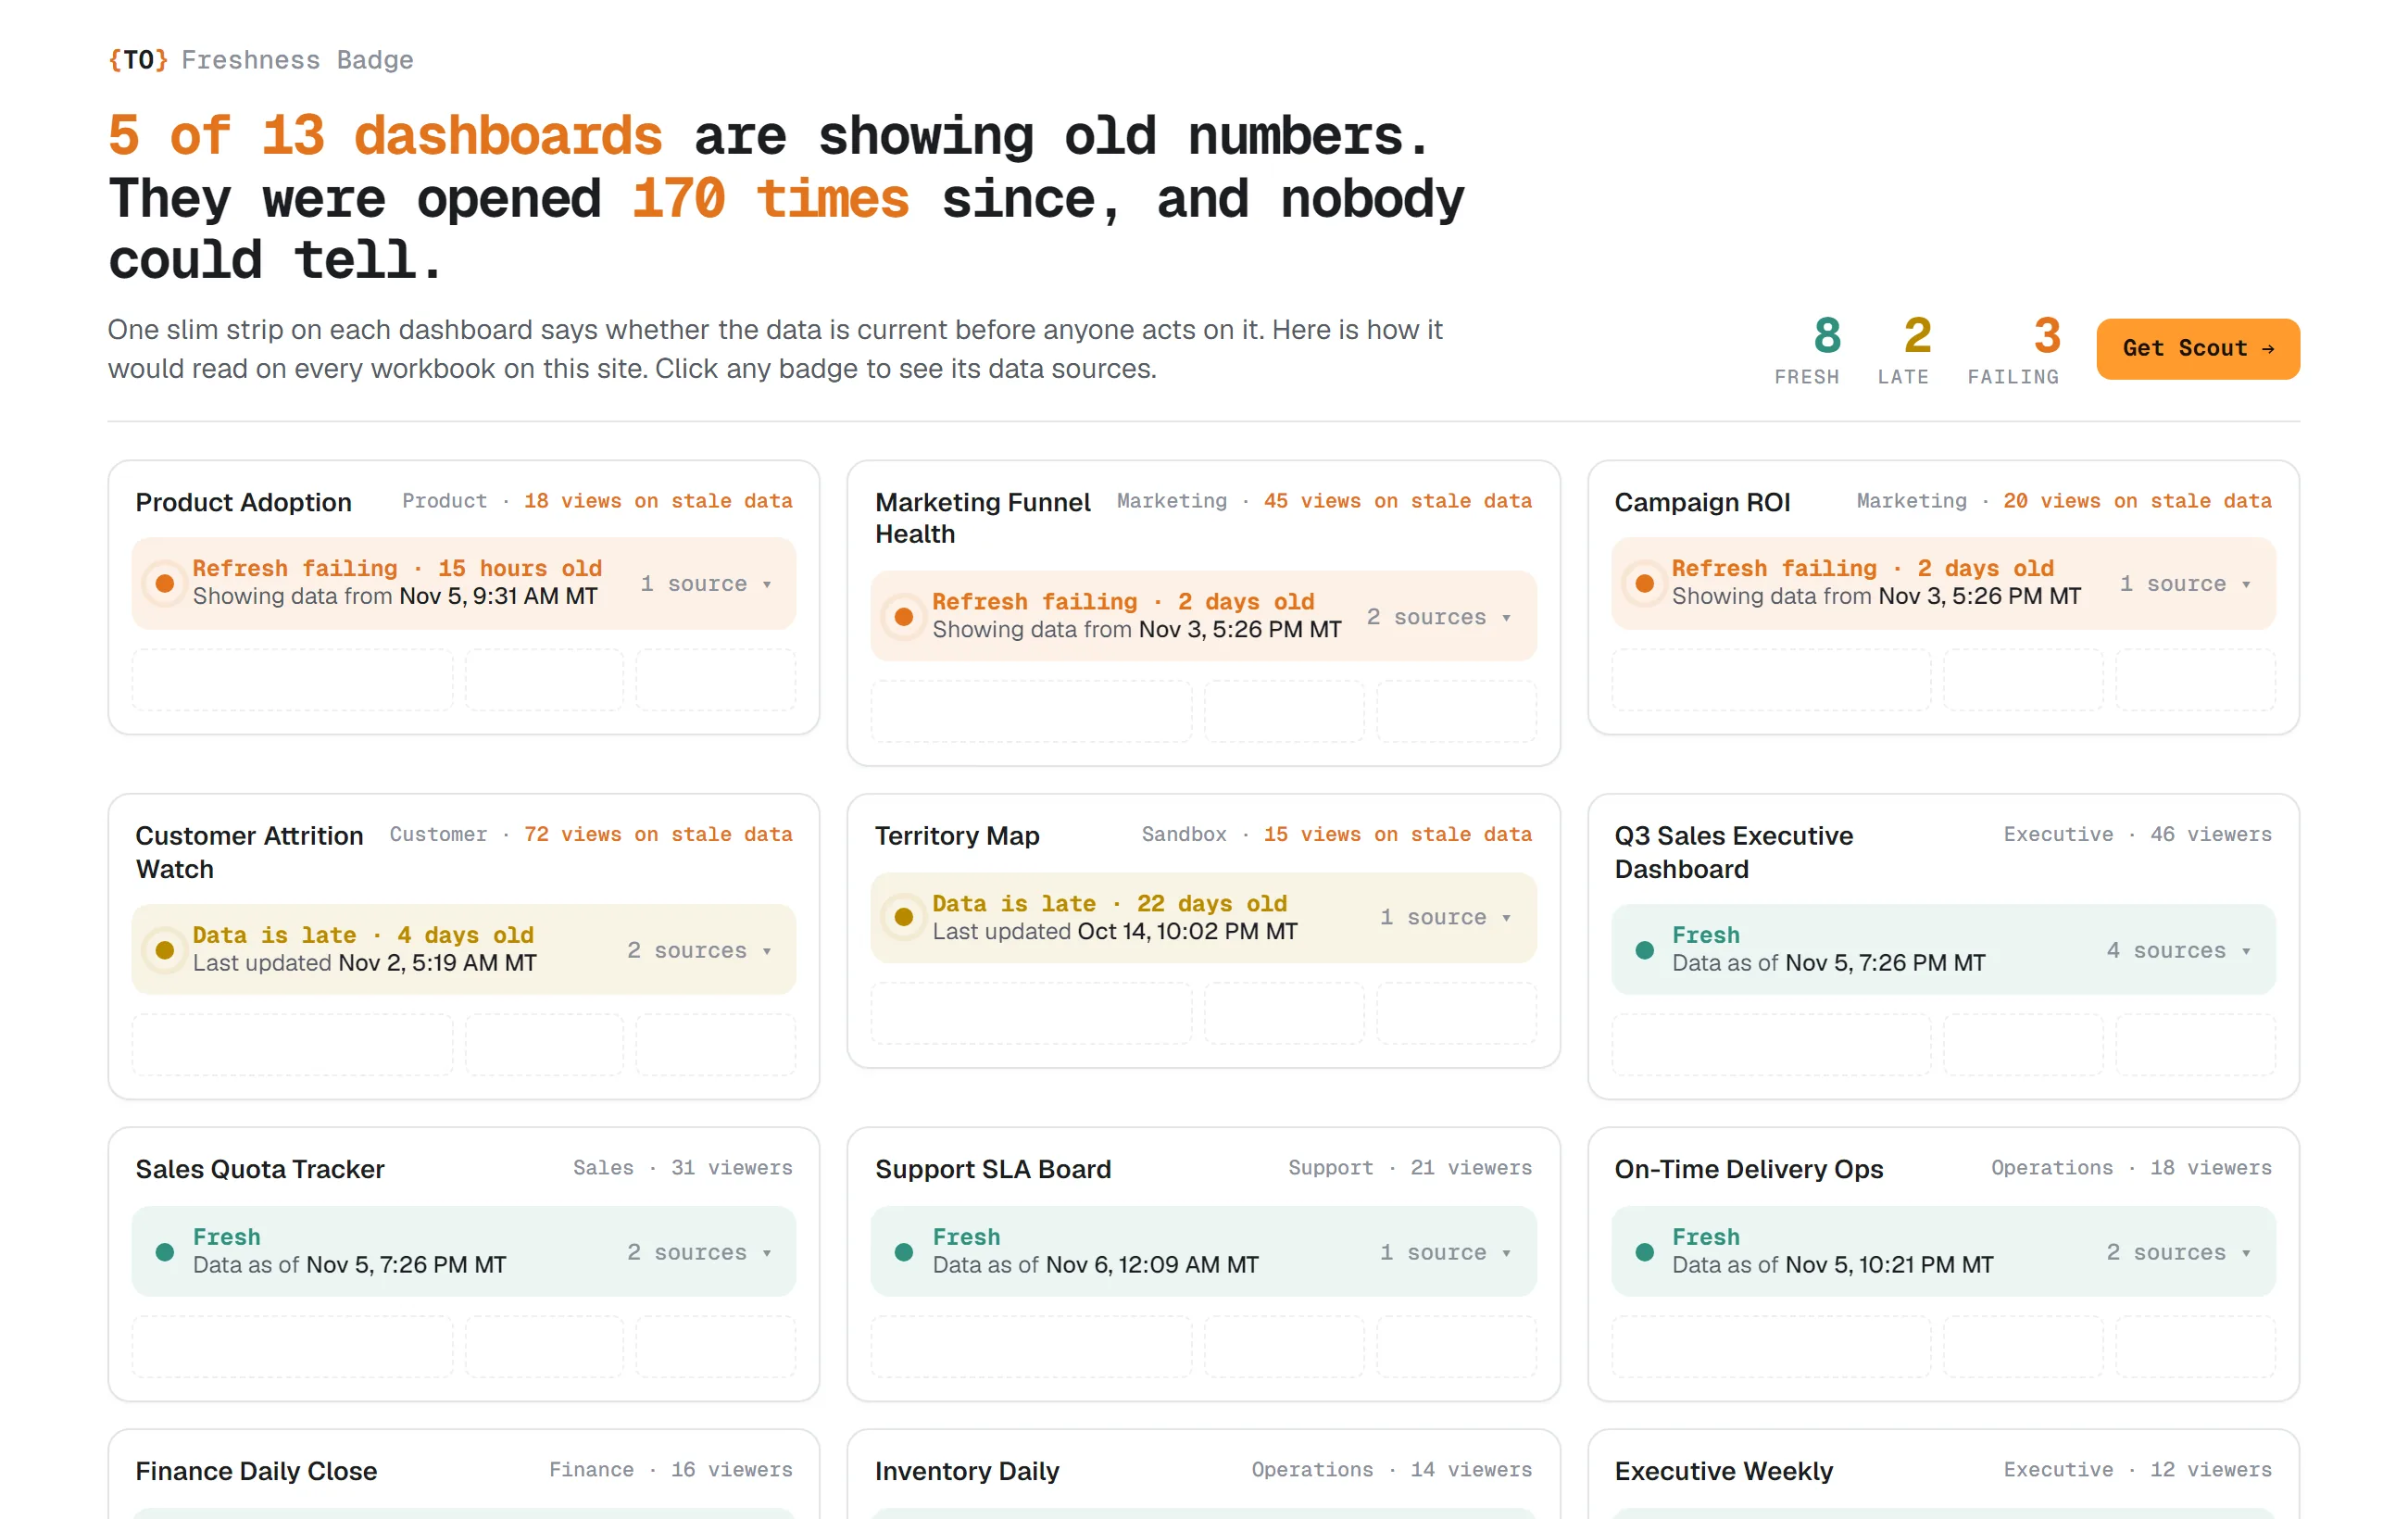
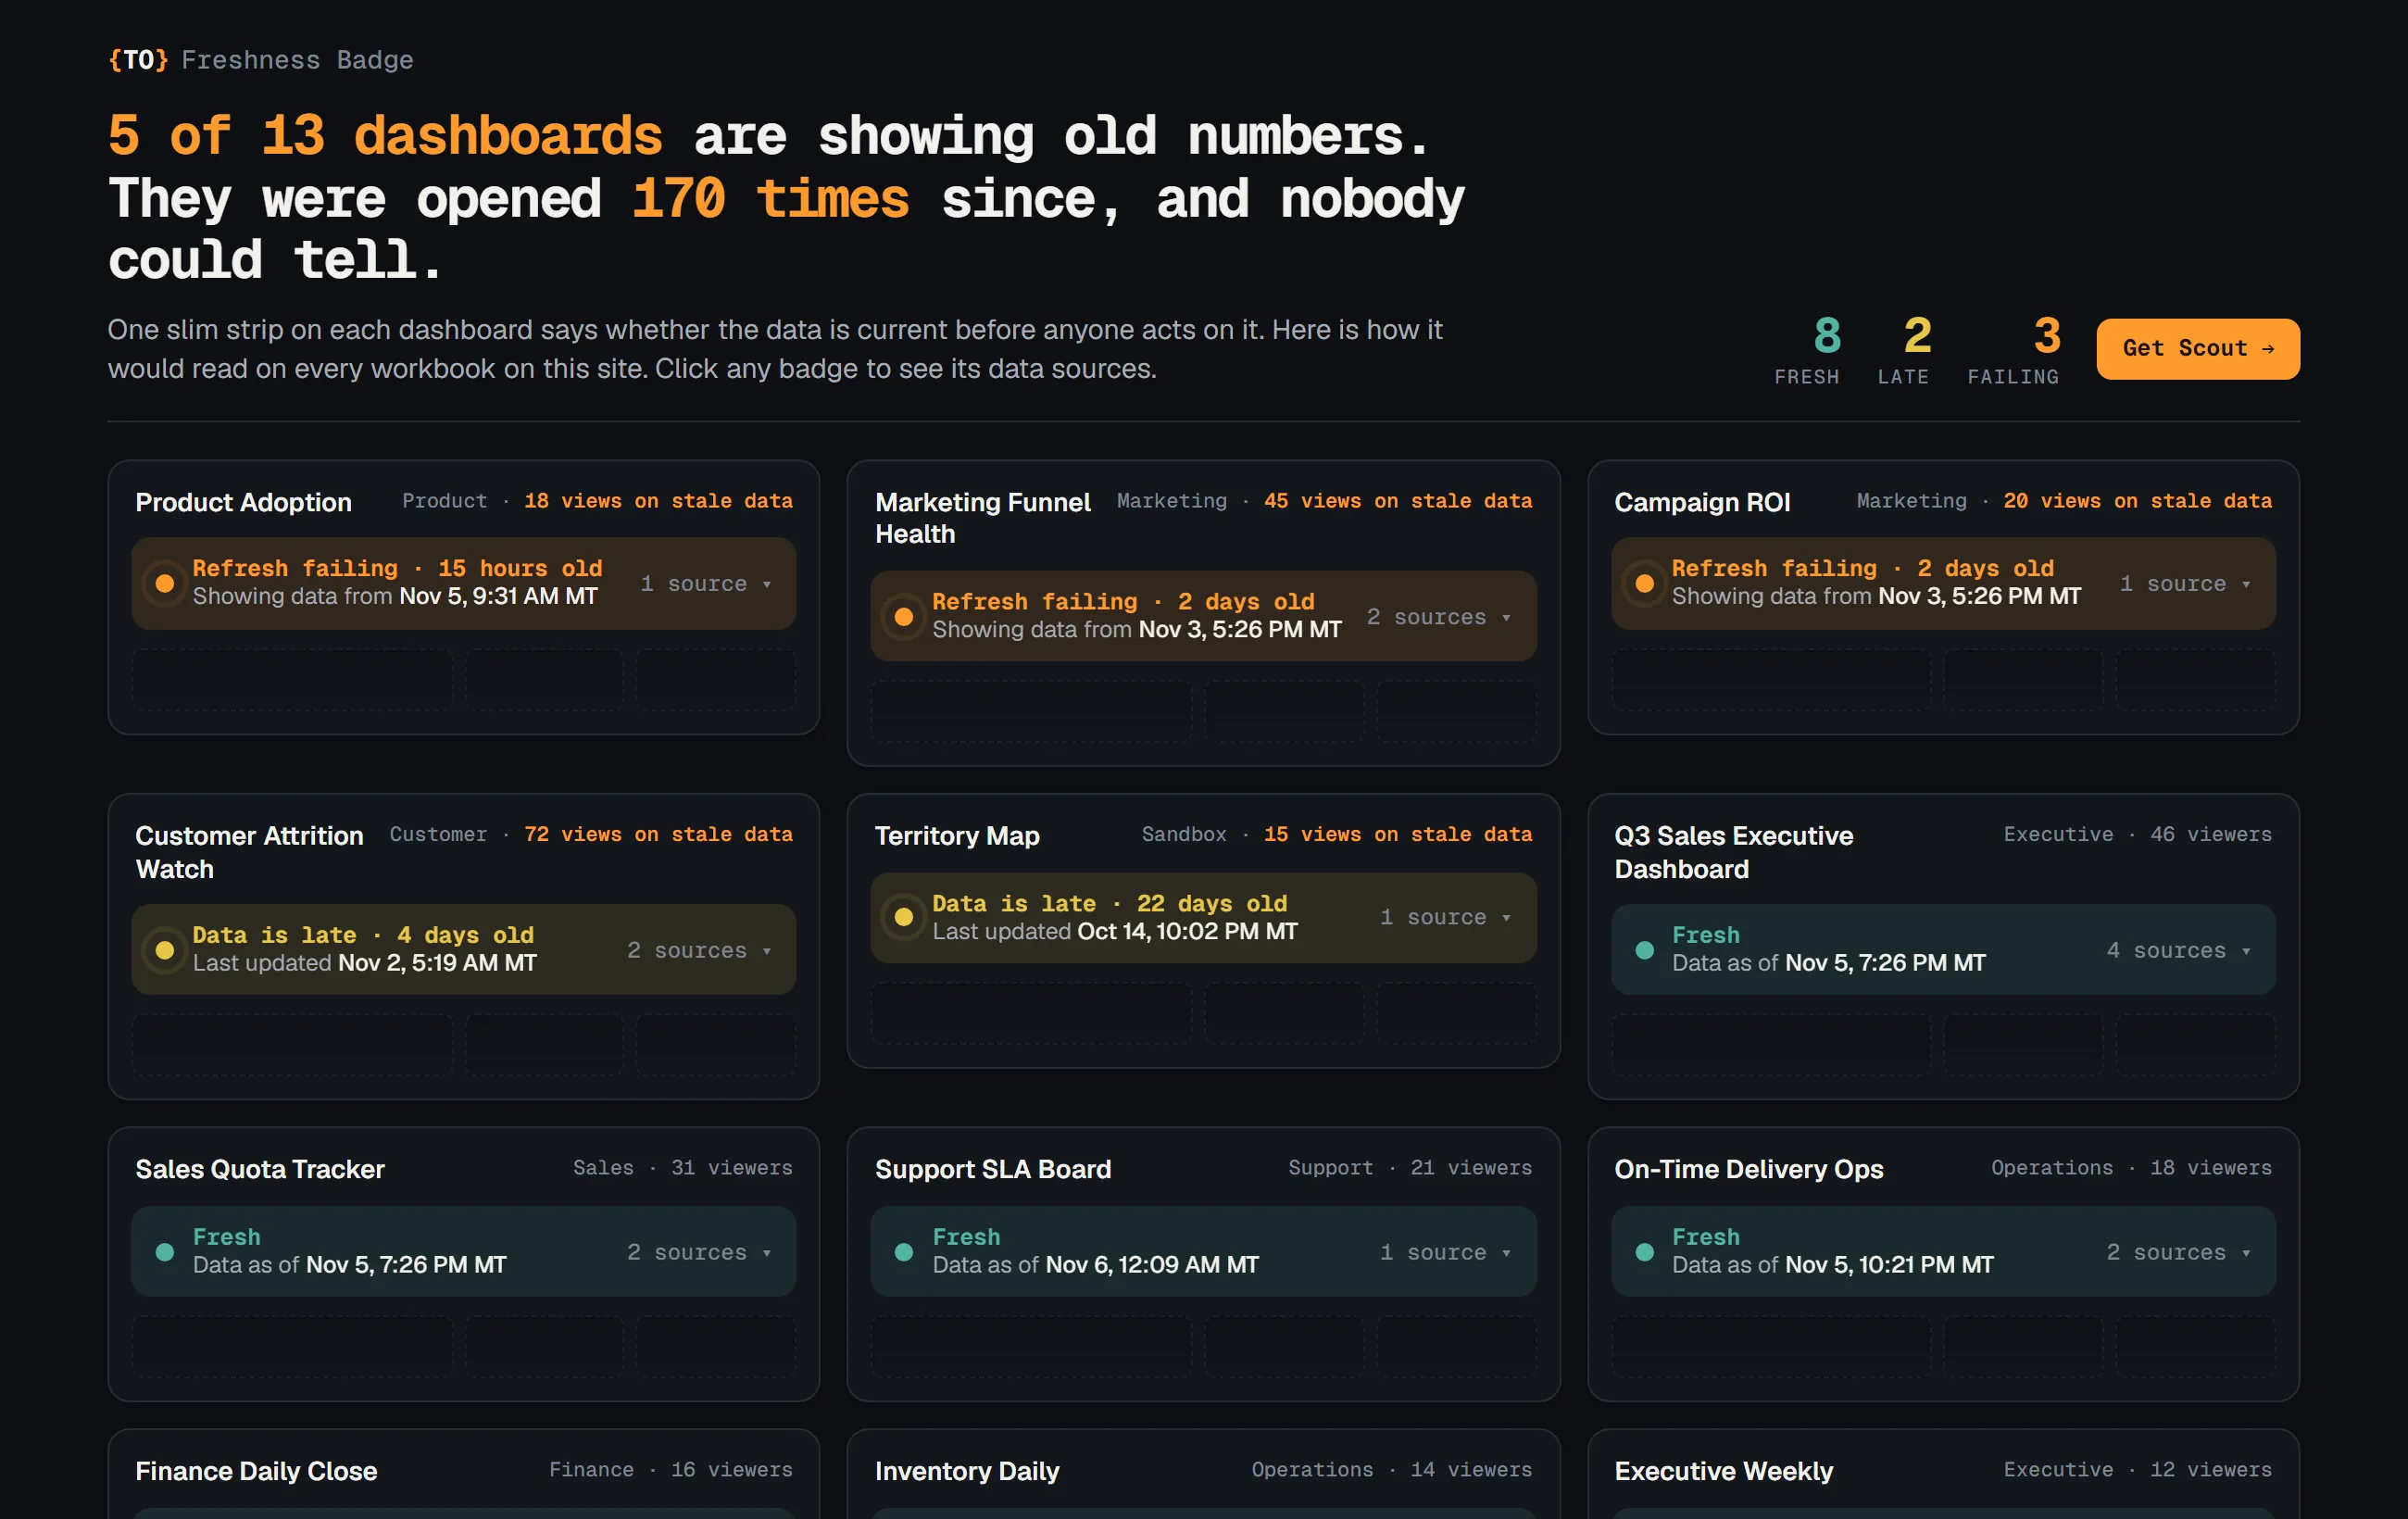
Tells every viewer how old the numbers are, right on the dashboard.
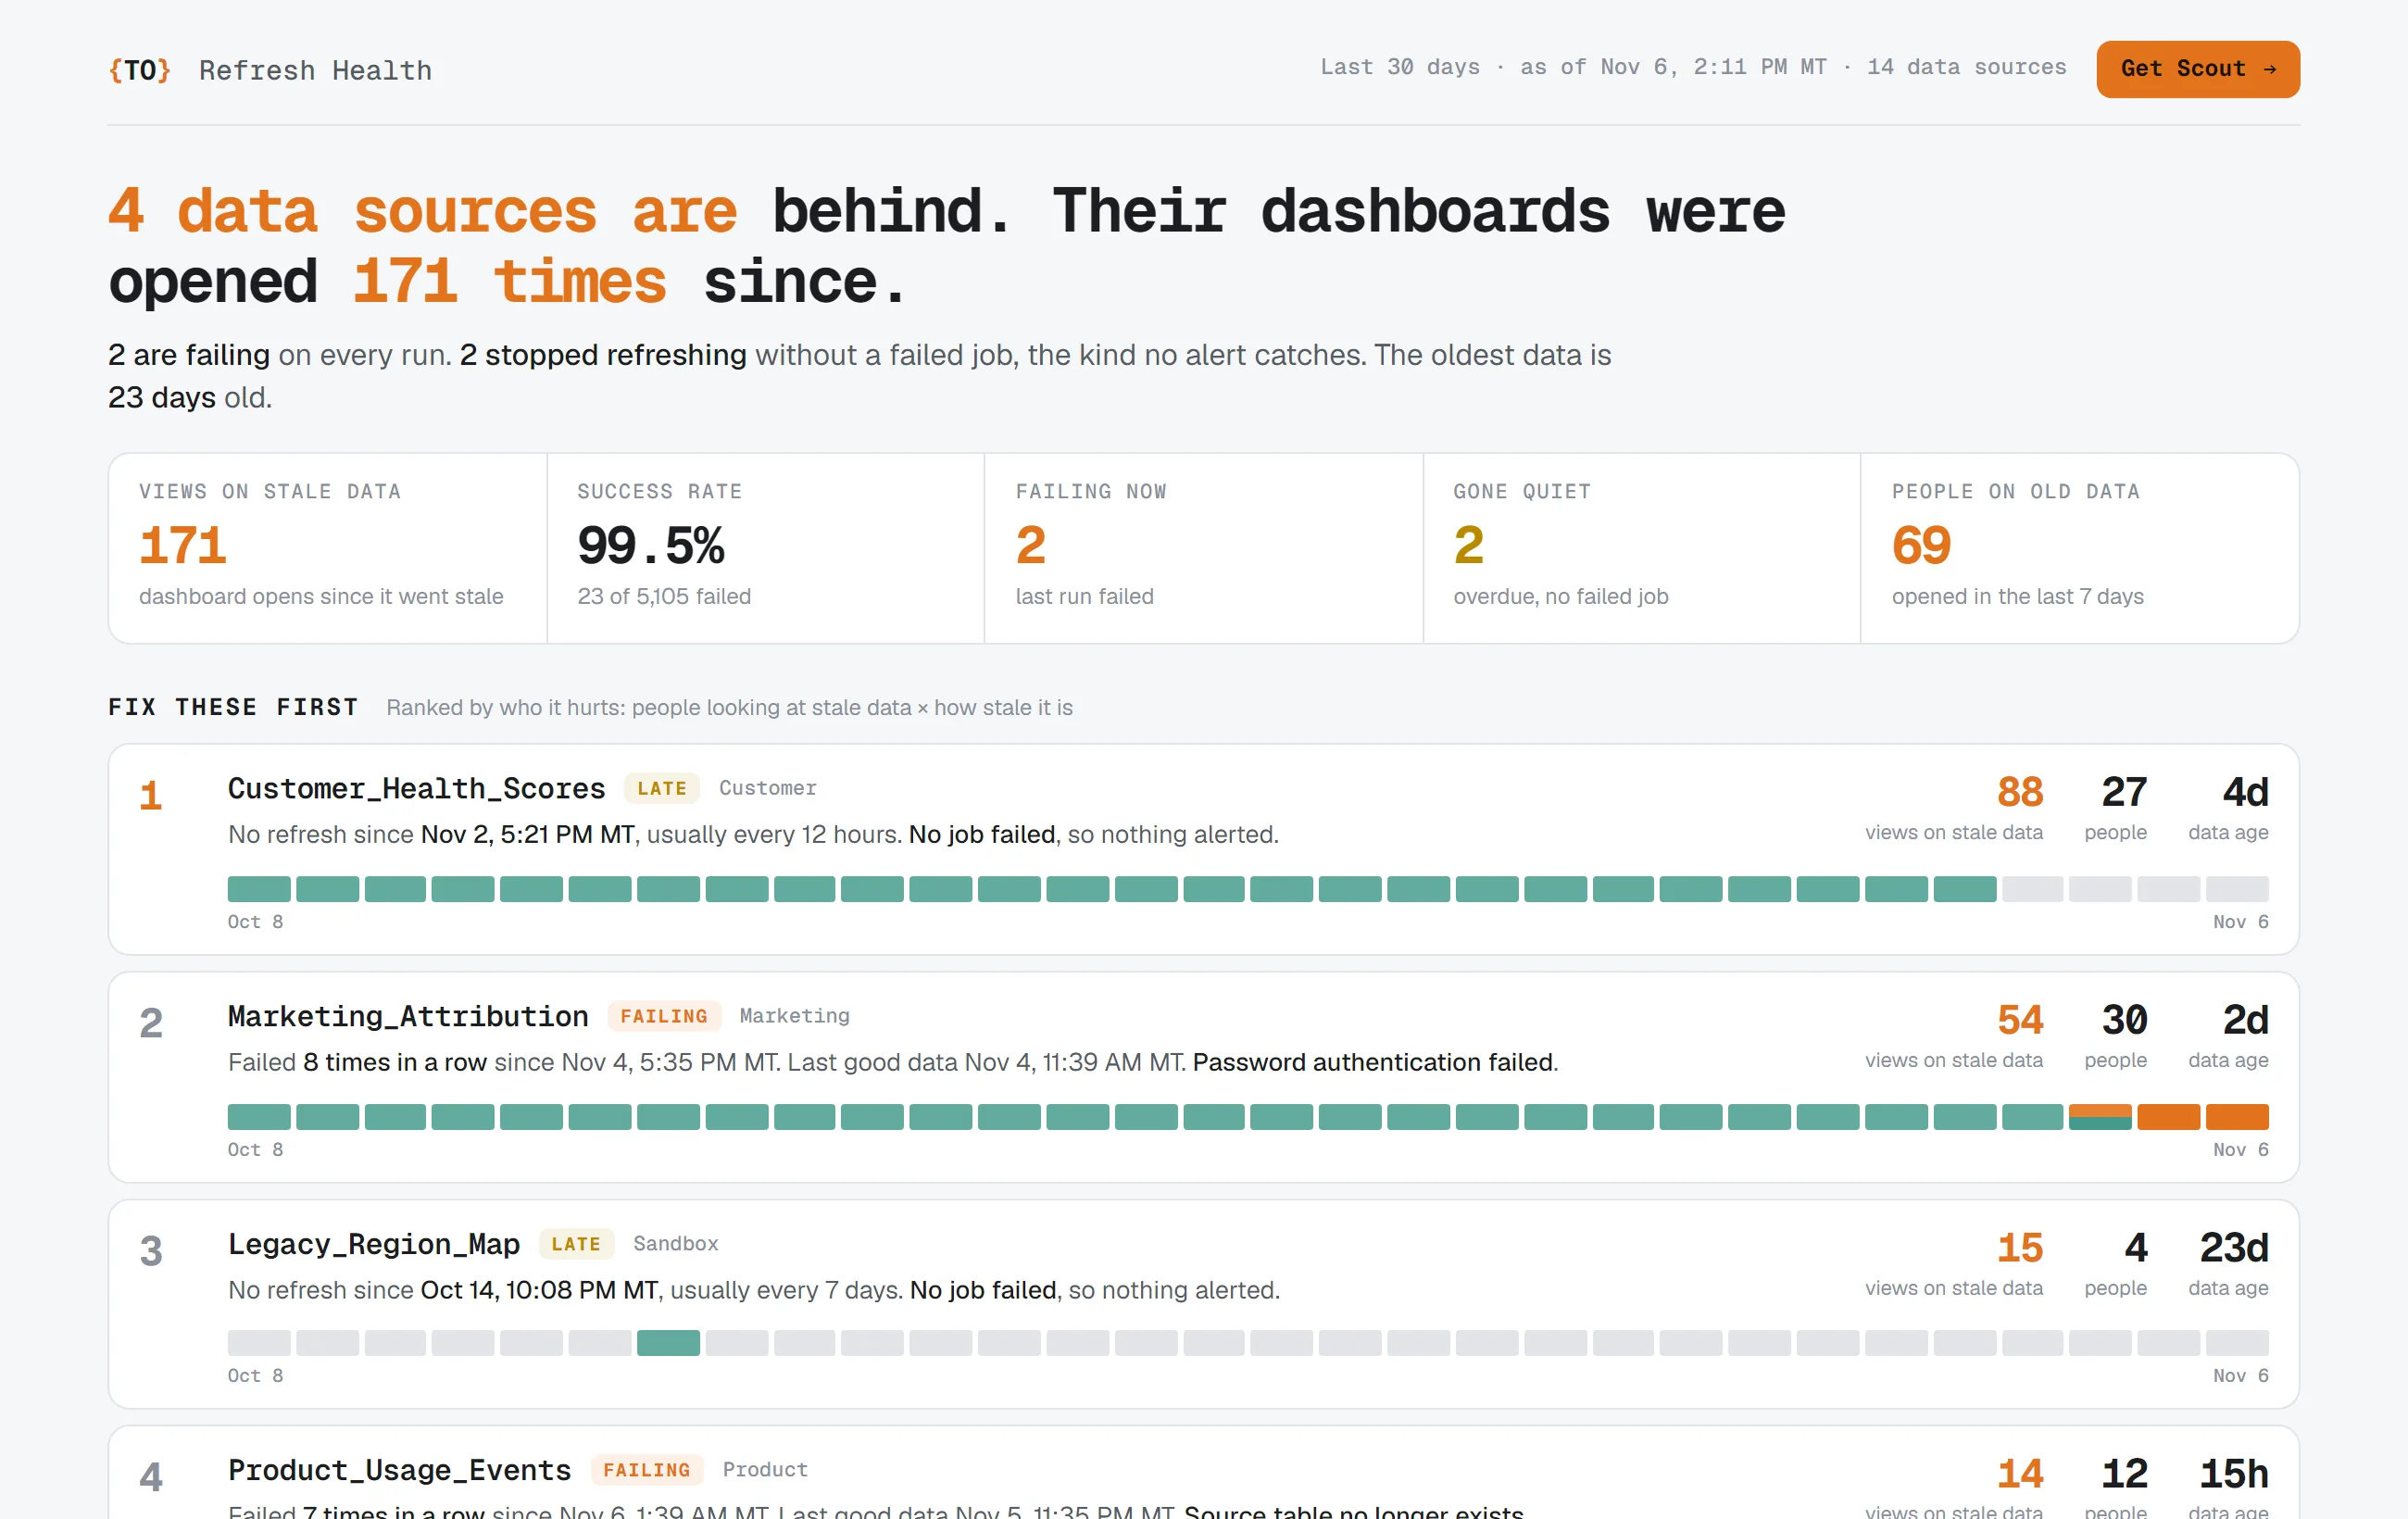
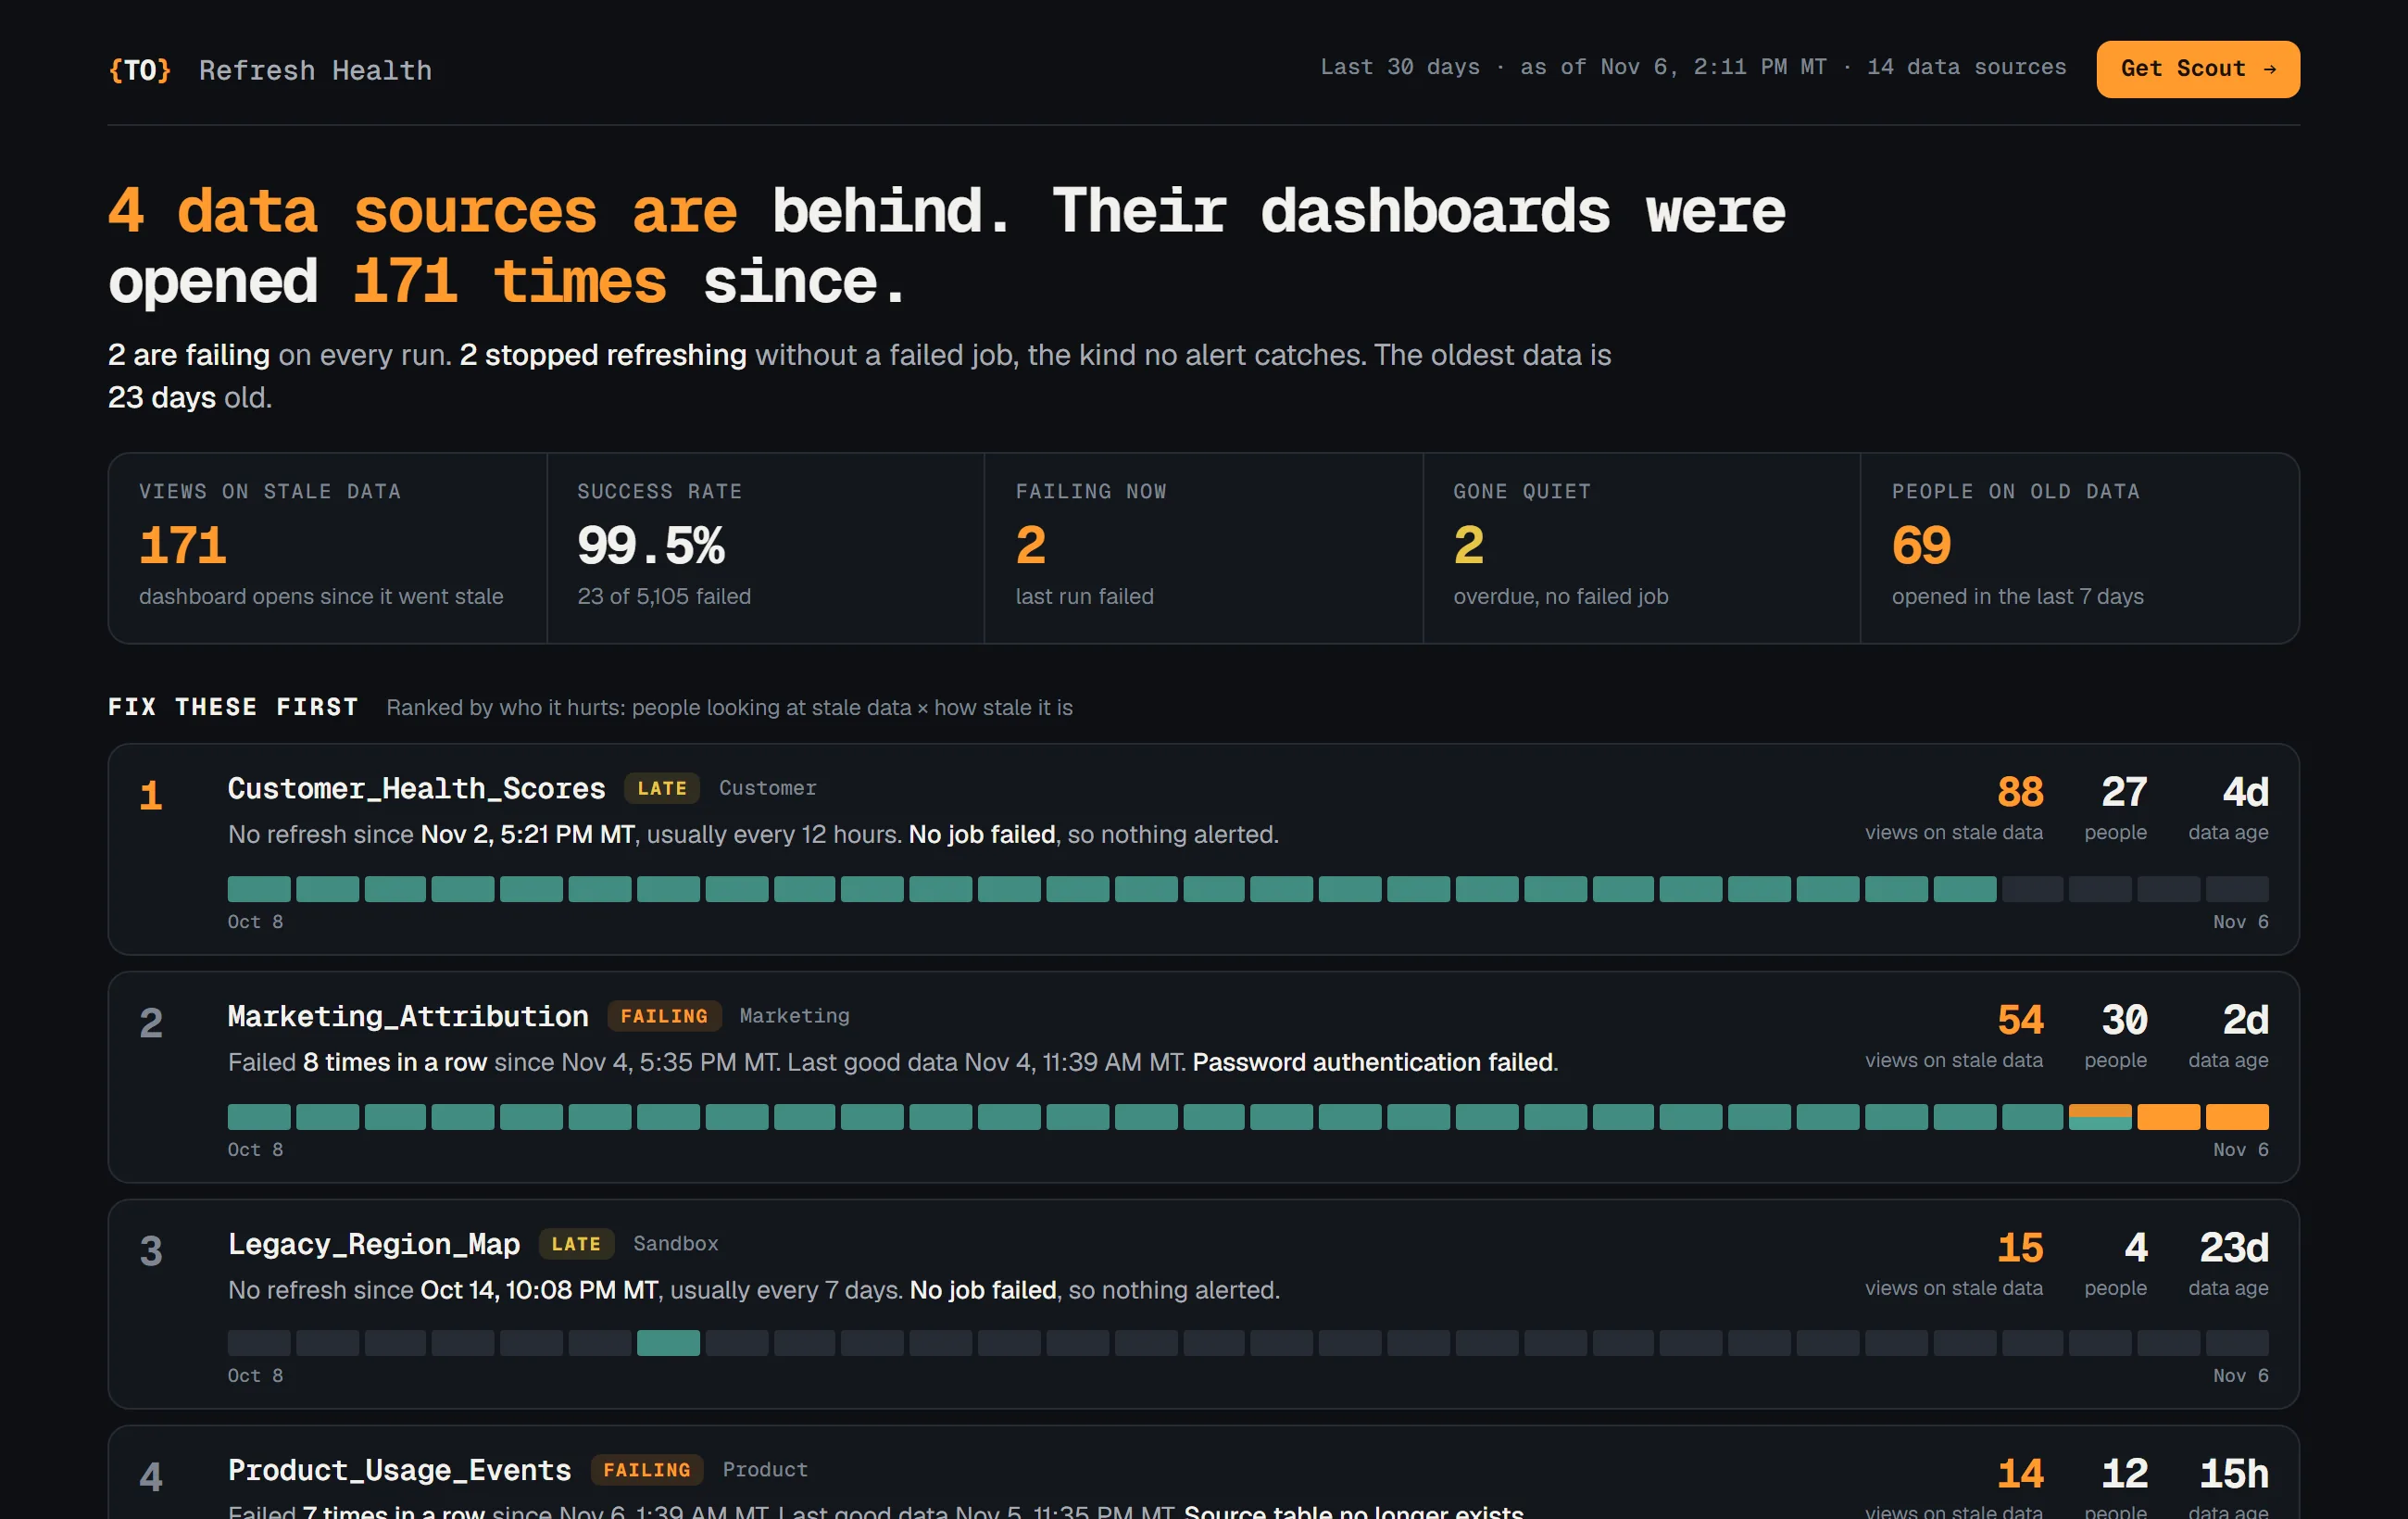
Which data sources are behind, and which dashboards people are still opening on them.
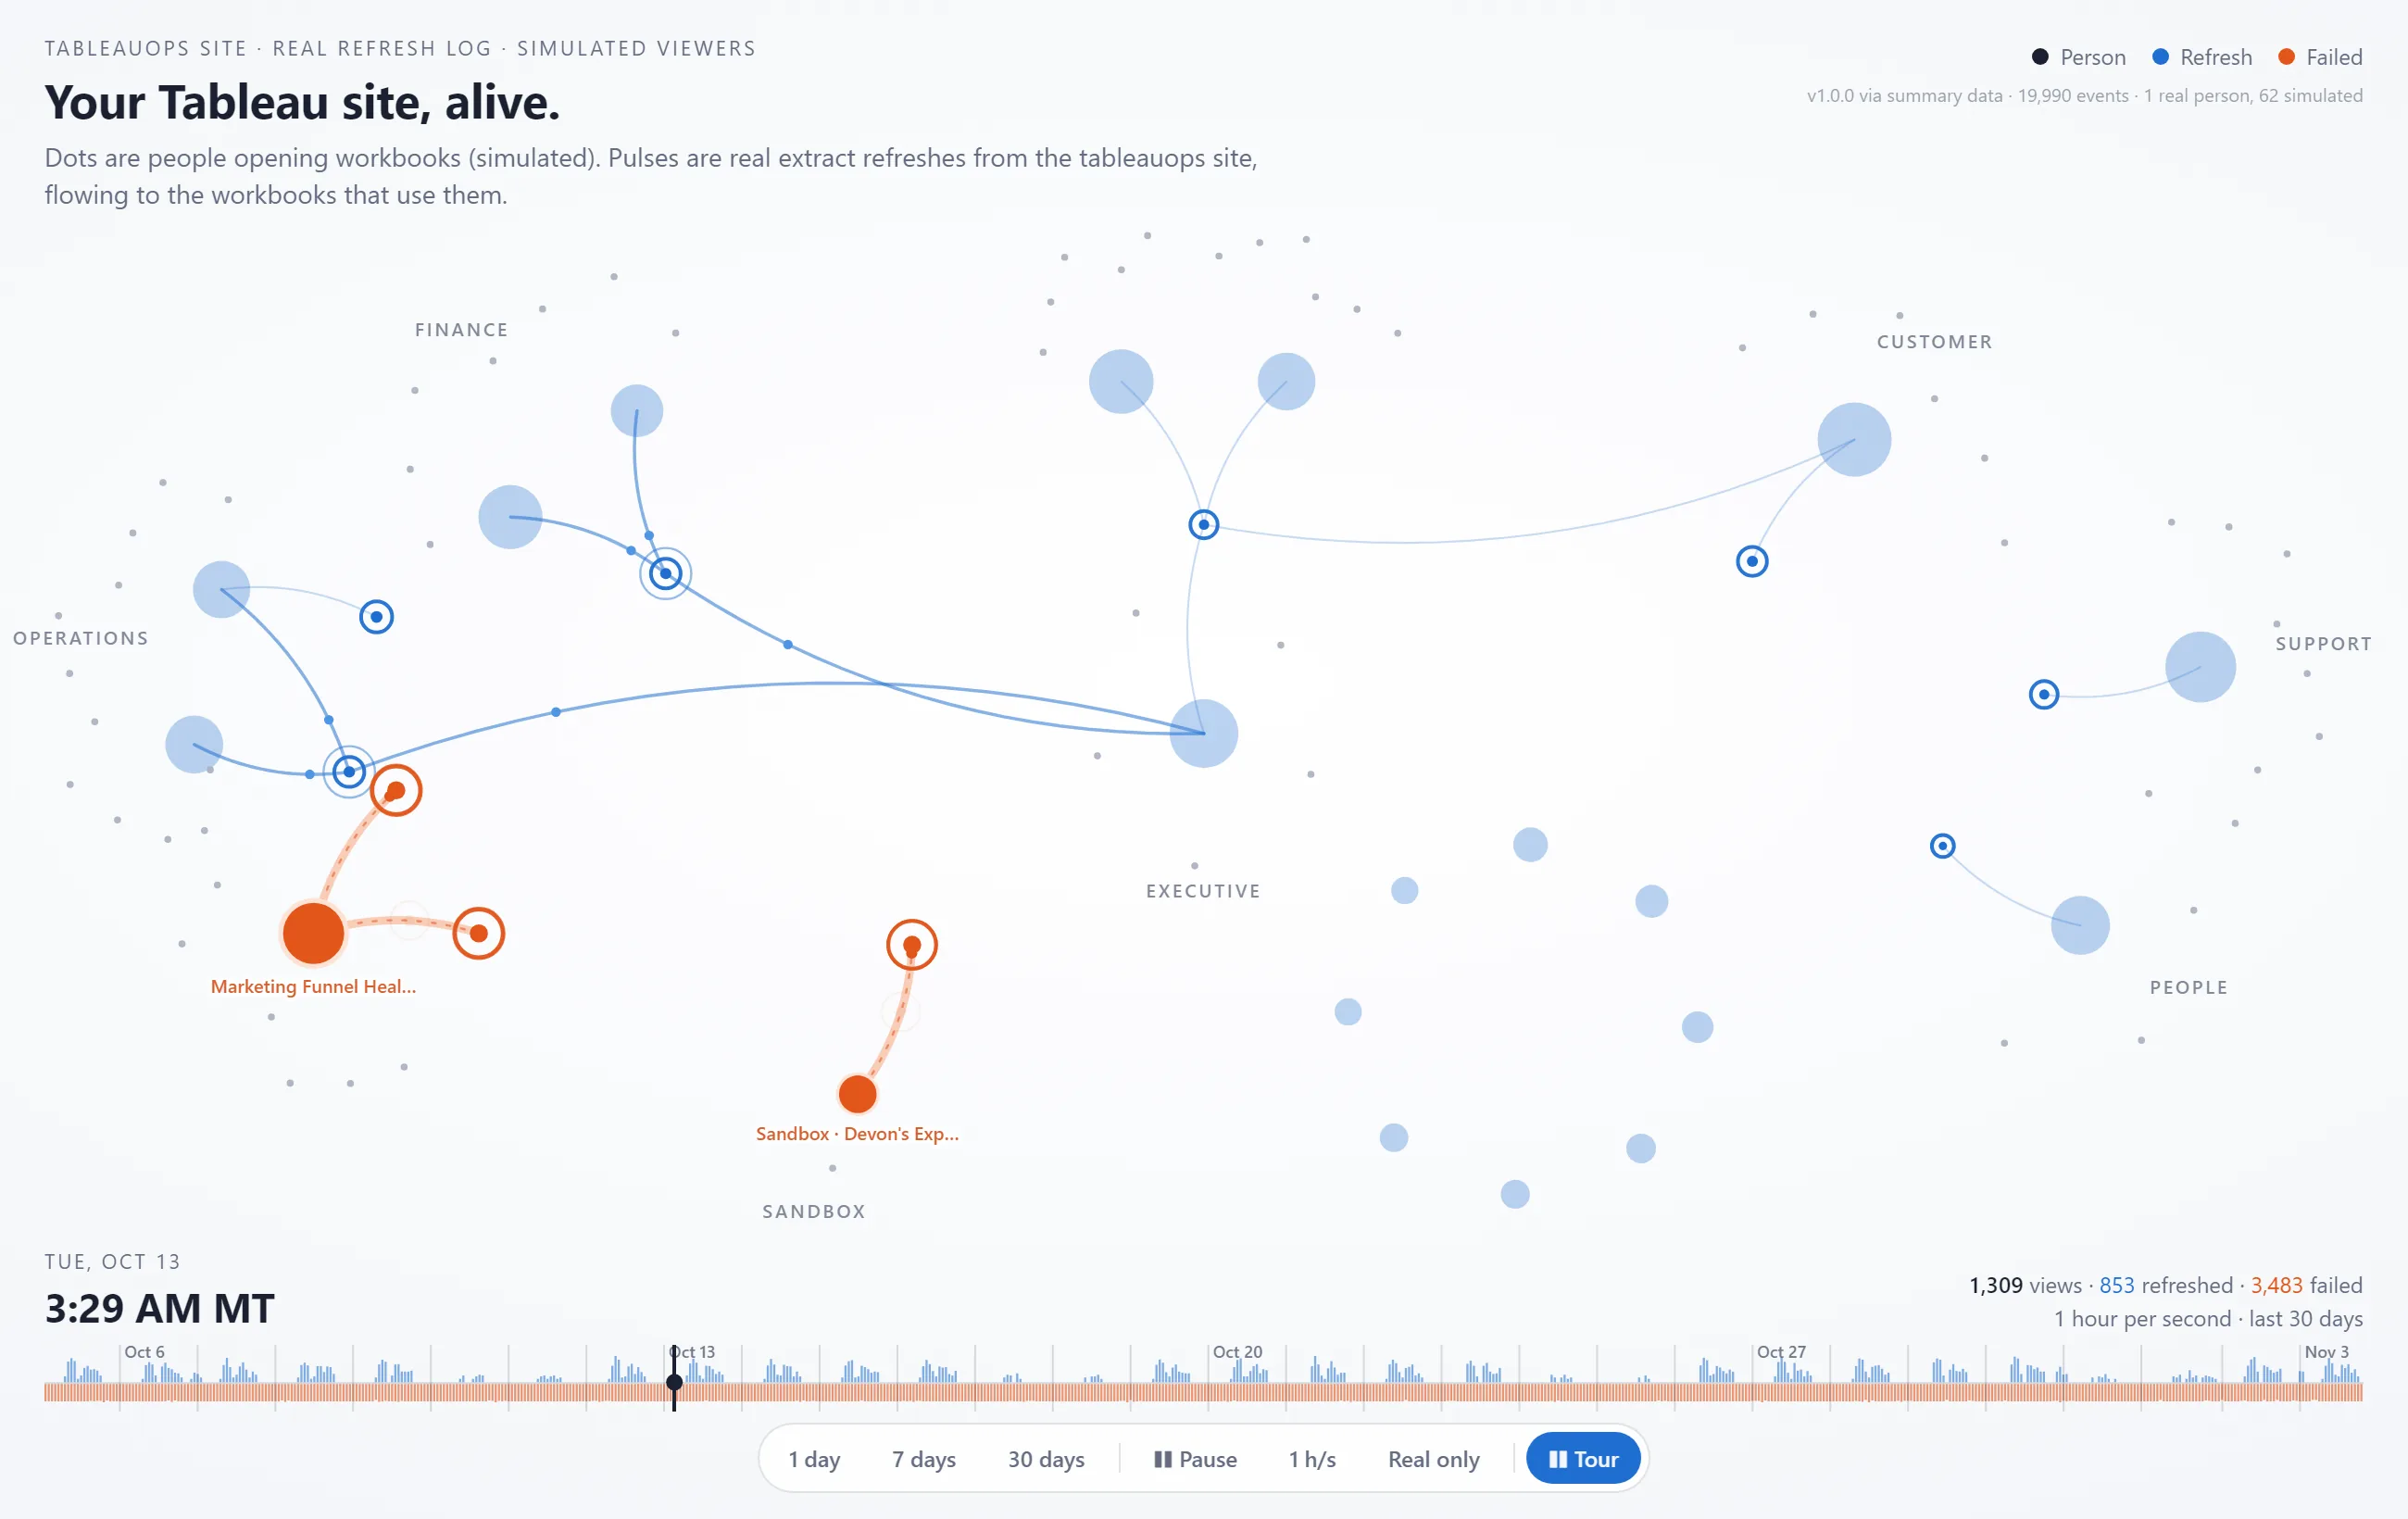
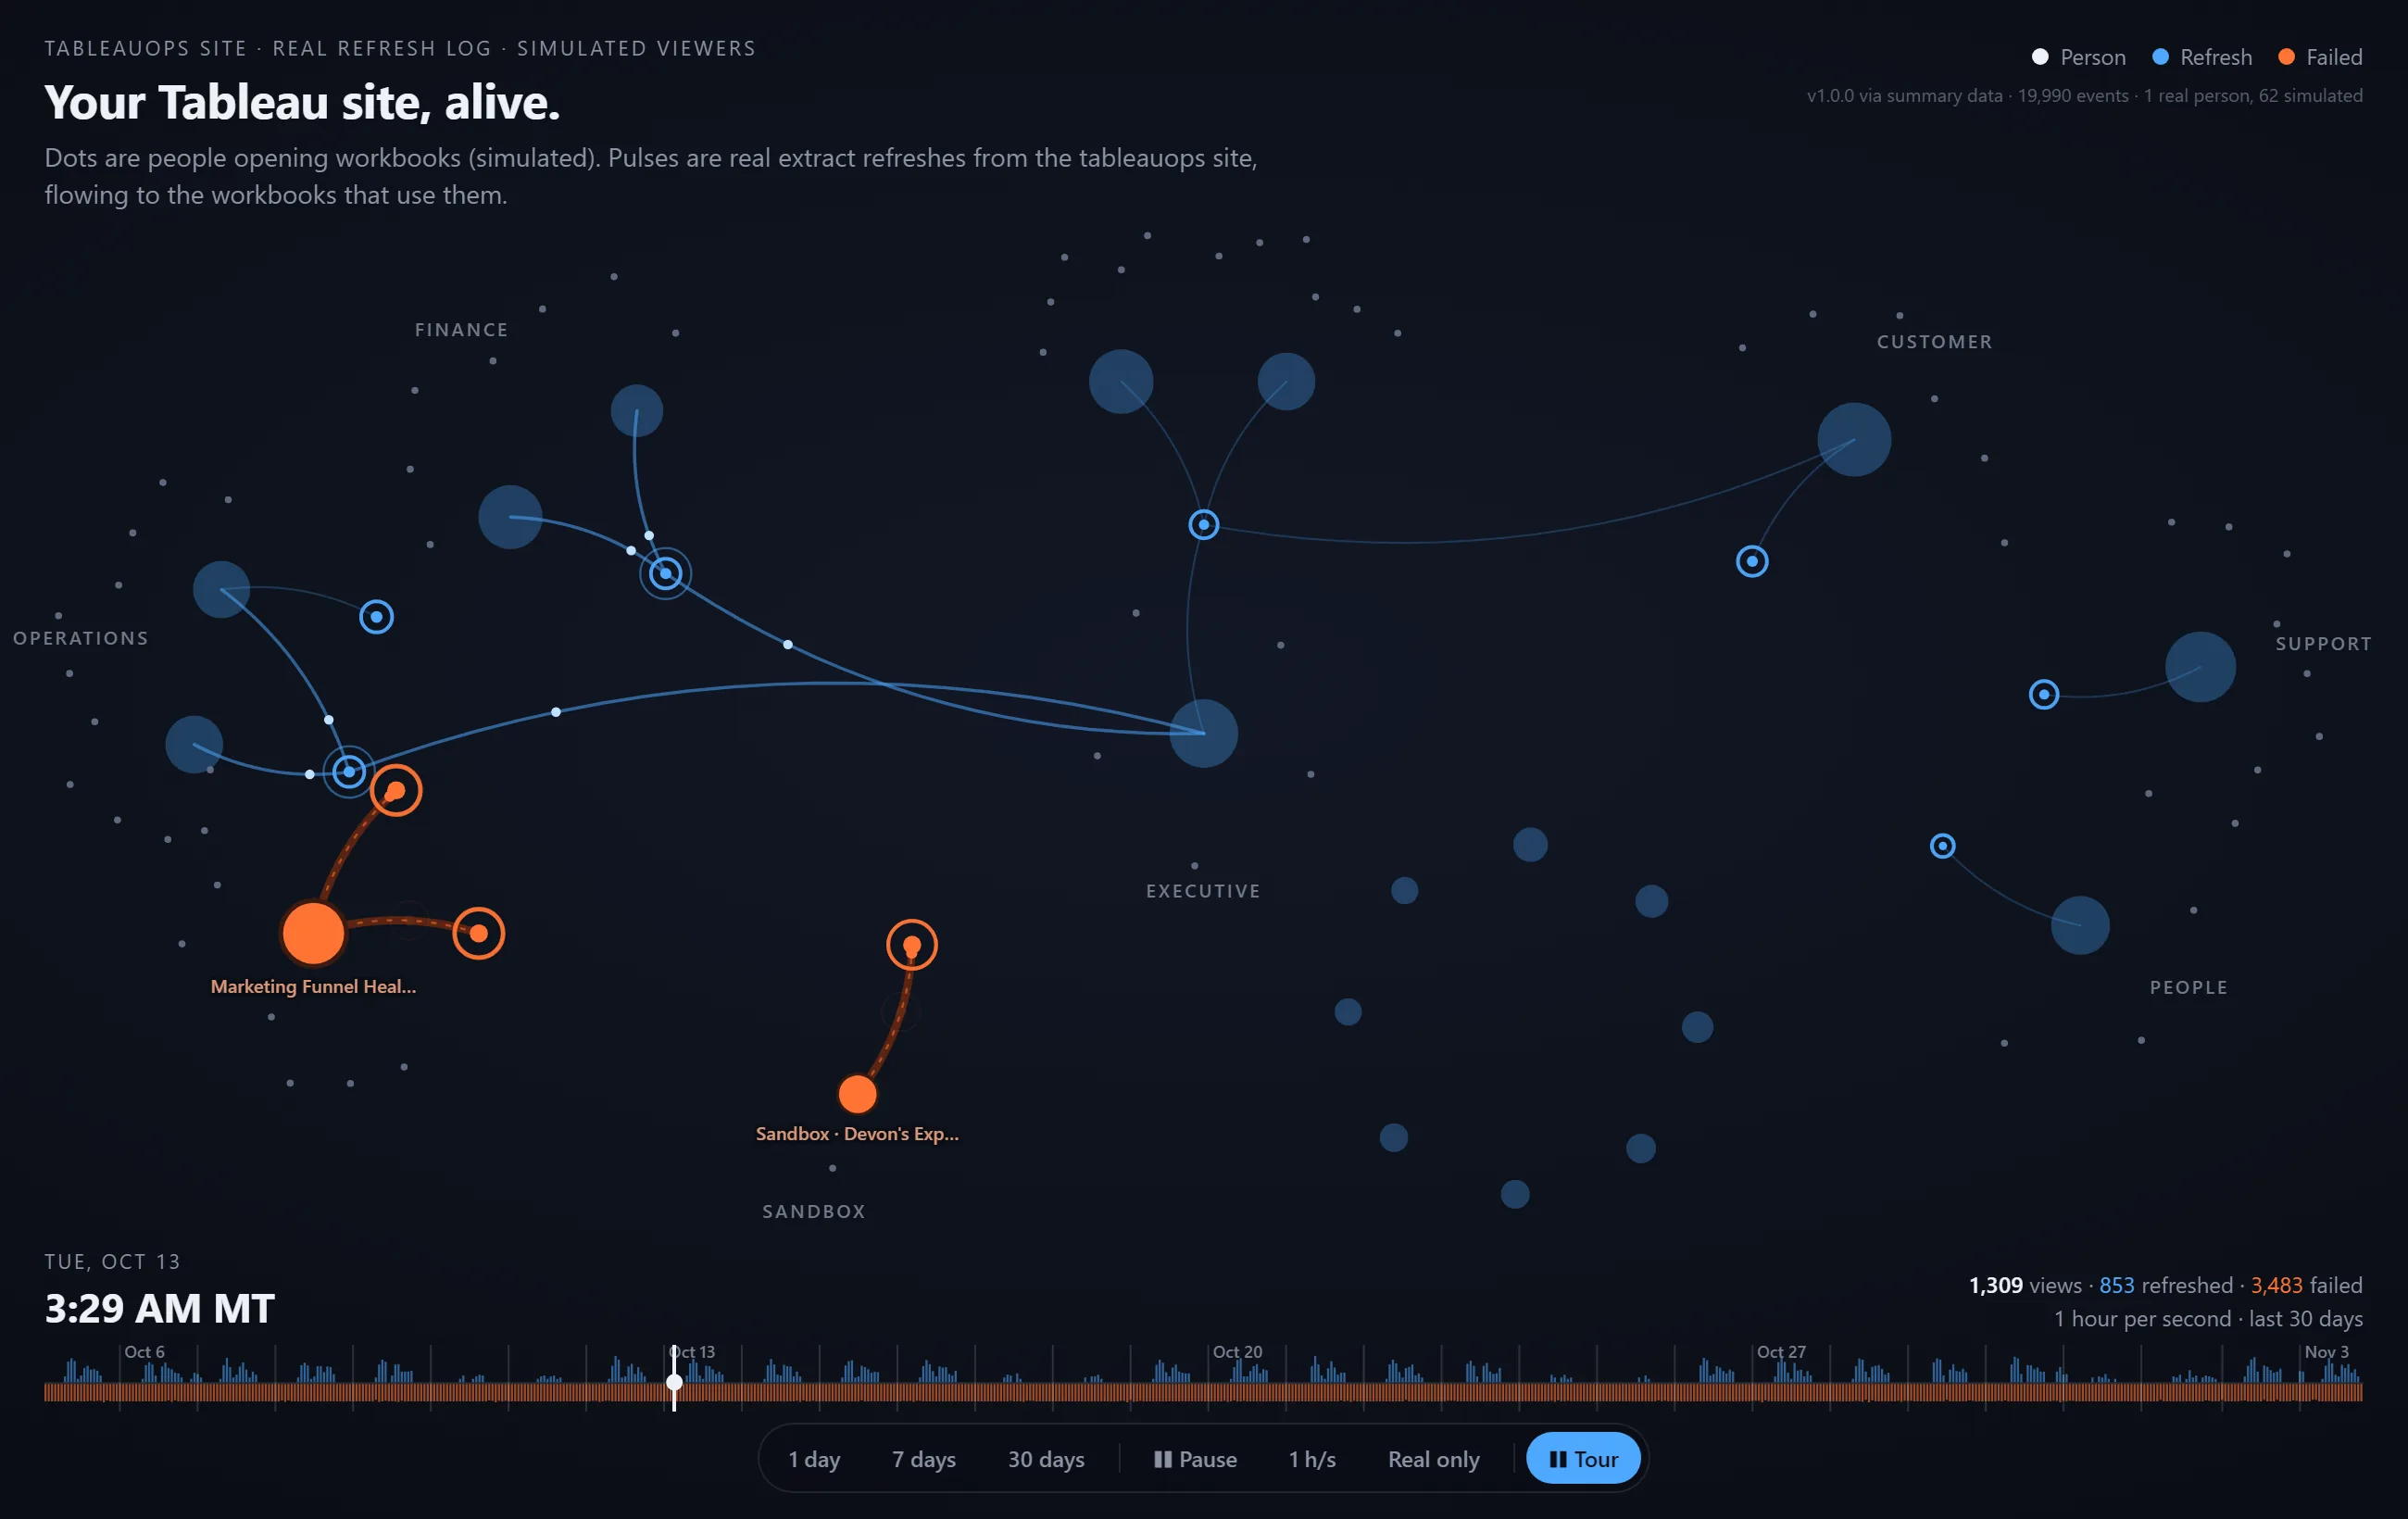
A real production site's views and refreshes as a live network, every name changed.
Freshness Badge is free. One download works on any Tableau Cloud site with Admin Insights, with a setup guide.
Get Freshness Badge// The rest of the shelf
21 apps, and what a data app can be.
Particles, puzzles, music, games and SQL lessons, mostly on Sample Superstore. Each opens in your browser.
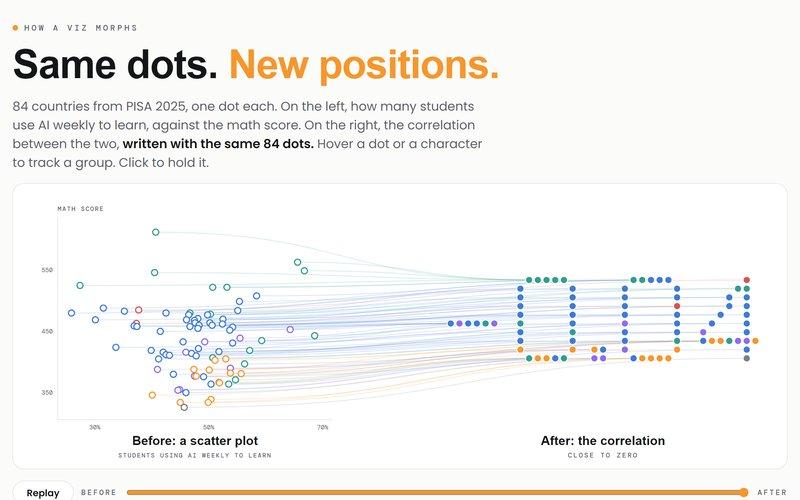
84 countries from PISA 2025 as a scatter of weekly AI use against math score, then the same 84 dots spelling the correlation: r = −0.04. Data: OECD, CC BY 4.0.
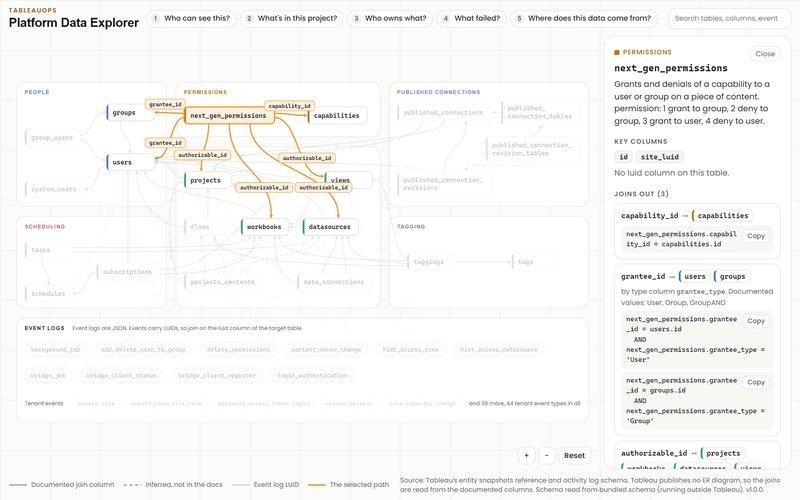
A map of Tableau Cloud's Platform Data API: all 22 entity snapshot tables, the columns that join them and the event logs that point at them.
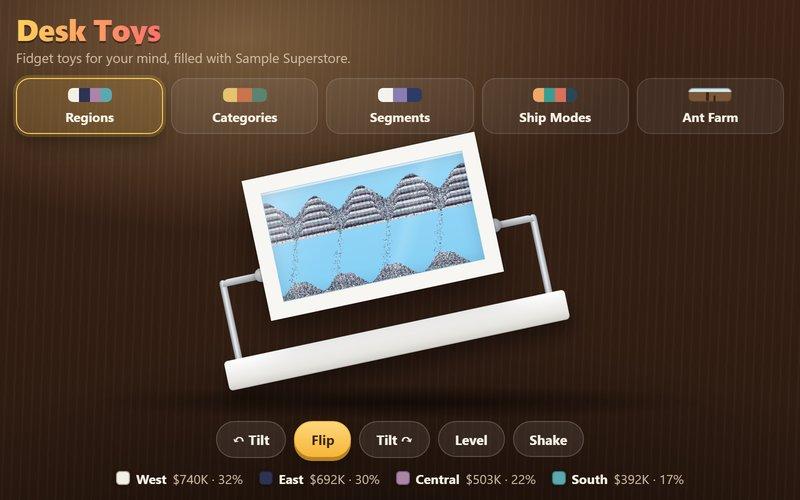
Moving sand pictures you tilt, flip and shake, layered by Sample Superstore sales, plus an ant farm with one ant per sub-category.
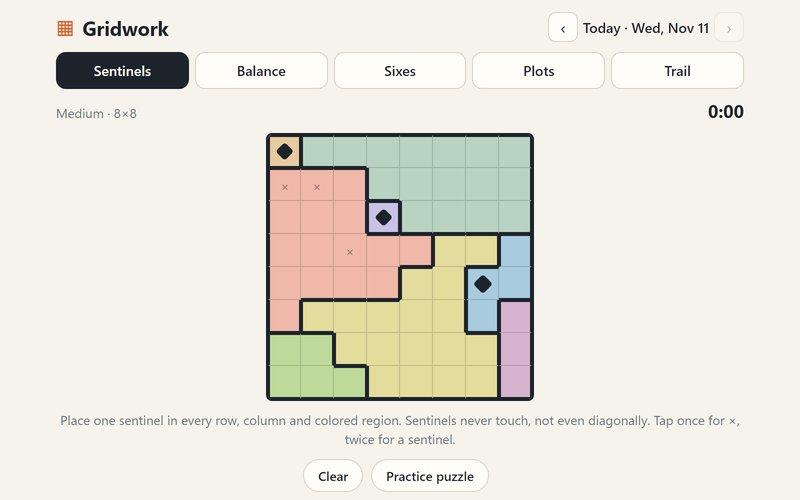
Five daily logic puzzles. Each day's seeds live in a Tableau data source, and every puzzle has exactly one solution.
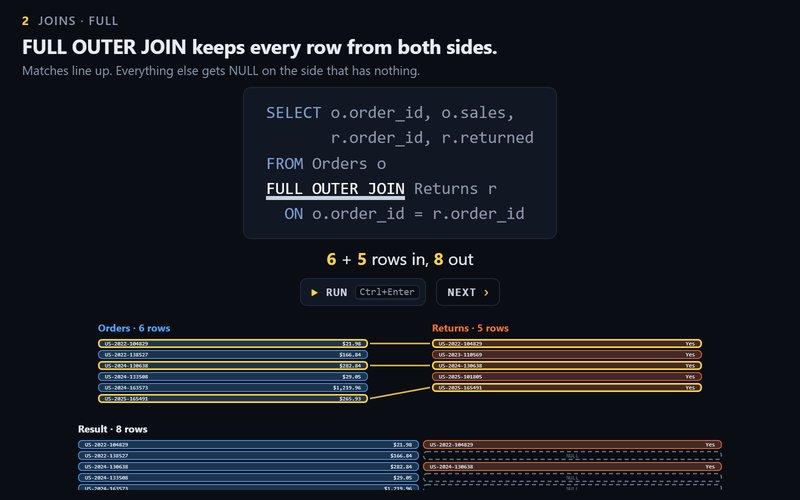
SQL you can watch: joins, row vs column storage, GROUP BY, indexes, NULLs and window functions, animated on real Superstore rows.
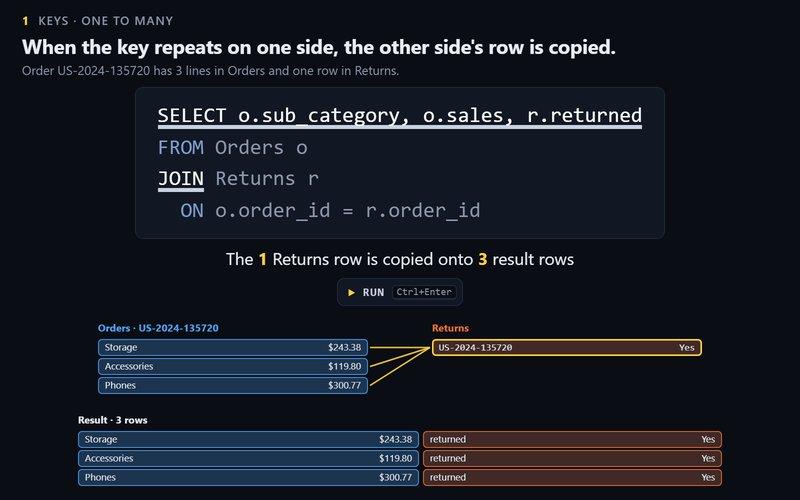
Keys, one-to-many copies, INNER to FULL OUTER, semi and anti joins, and why row counts change.
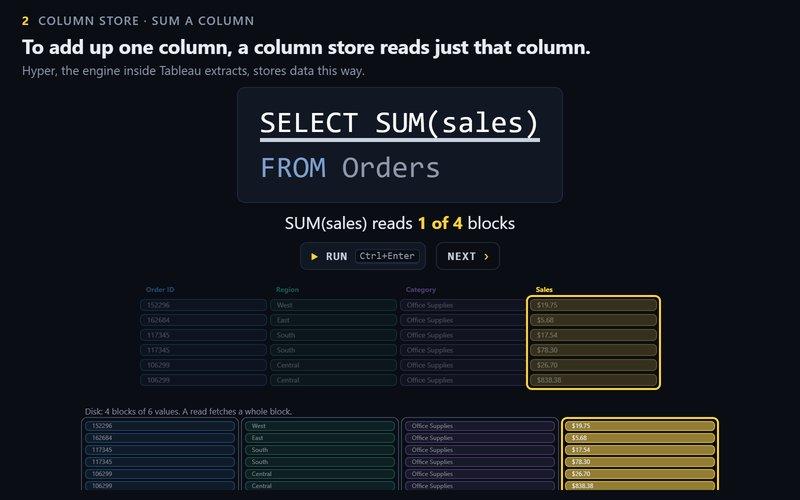
Row stores vs column stores: what each one reads for a sum, a lookup and an insert, and how columns compress.
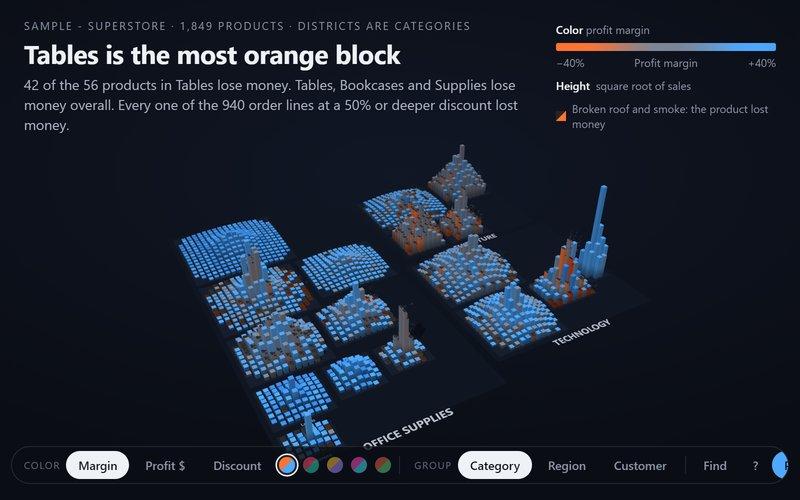
Superstore as a 3D city: one building per product, height from sales, color from profit. Loss-makers are cracked and smoking.
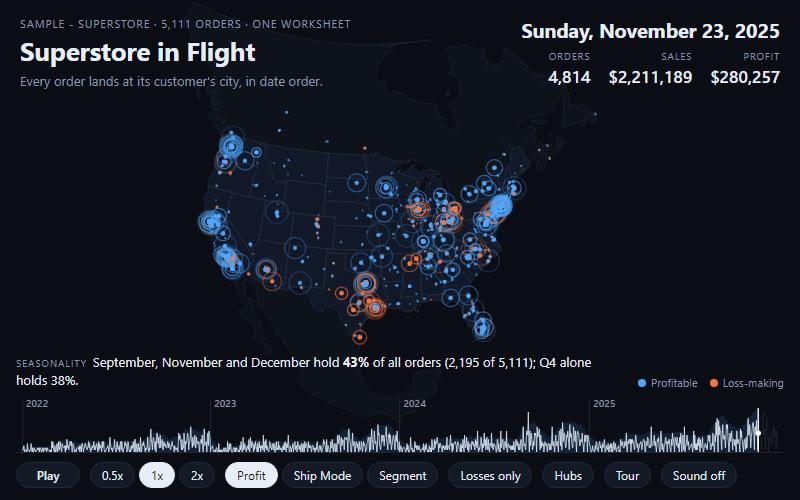
Four years of Superstore orders in 30 seconds: 5,111 arcs to customer cities in date order.
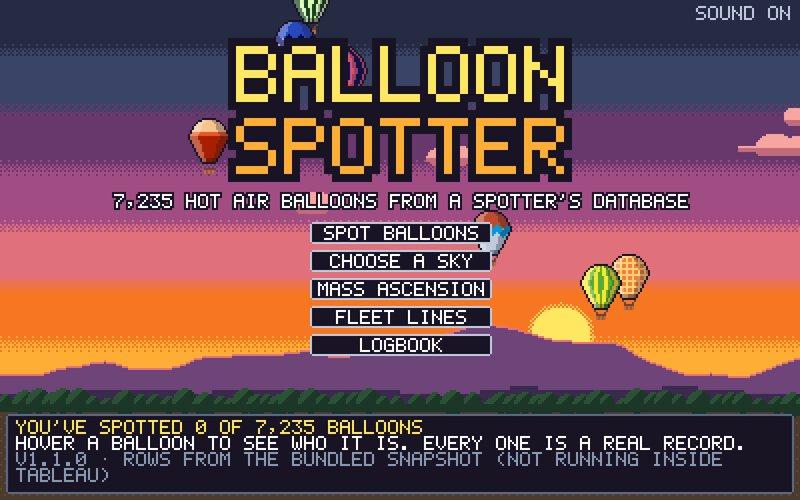
7,235 hot air balloons from a spotter's database. Explore by home, owner, maker, type or era, and keep a logbook.
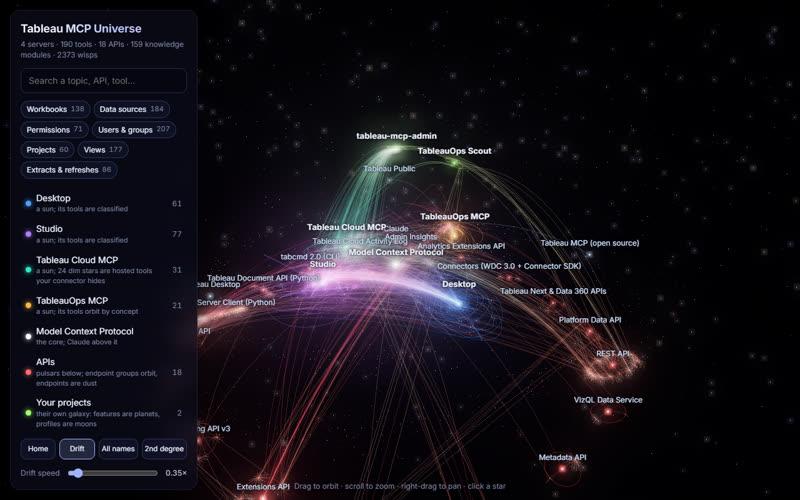
Every Tableau MCP tool, API and knowledge module as a 3D star map. Search a topic and see what can reach it.
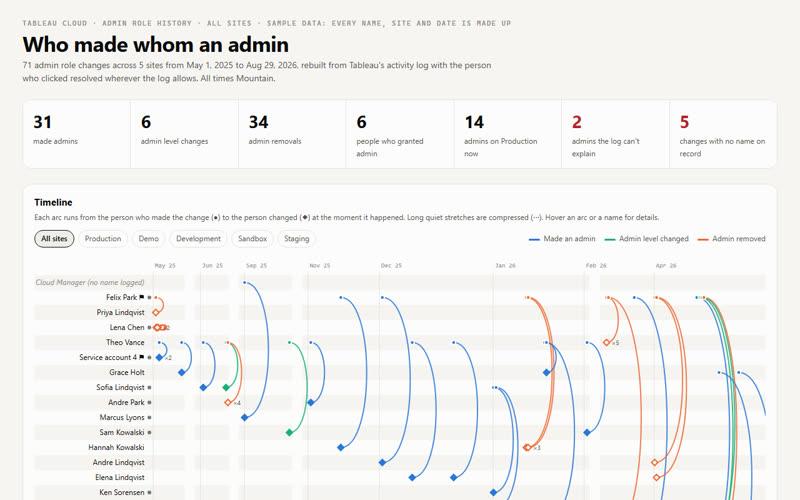
Who made whom a site admin, rebuilt from the activity log. Sample data: every name and site is made up.
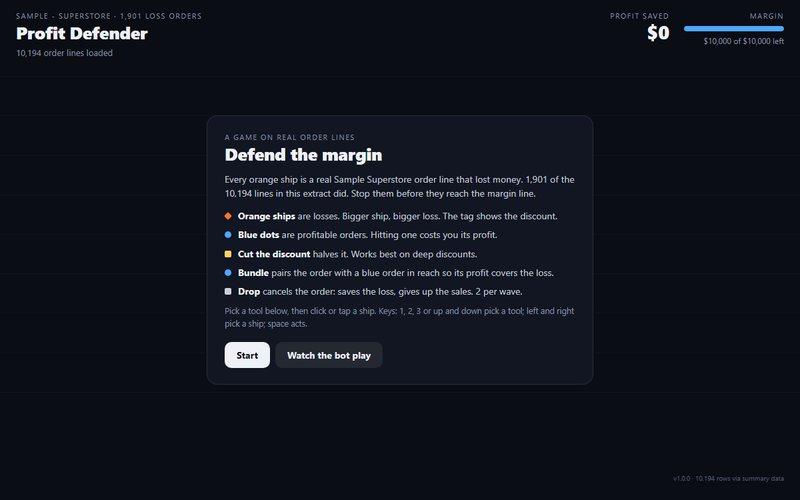
An arcade game on real Superstore order lines: stop the loss-making orders before they reach the margin line.
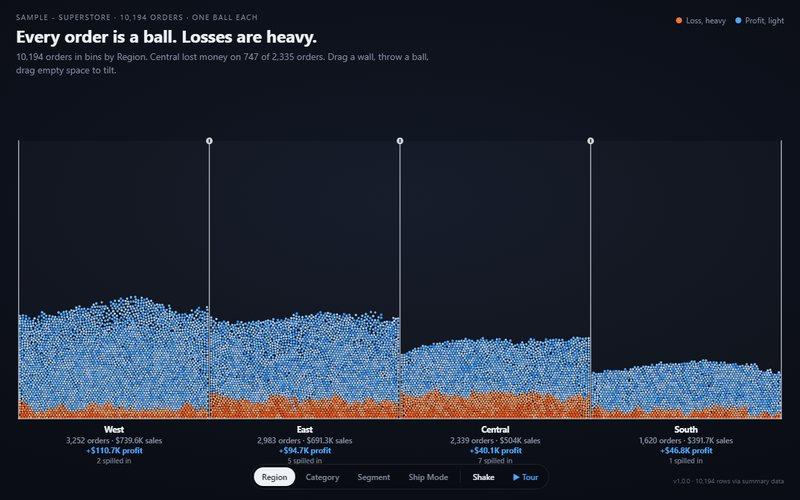
10,194 Superstore orders as balls in a physics sandbox. Losses are heavy and sink.
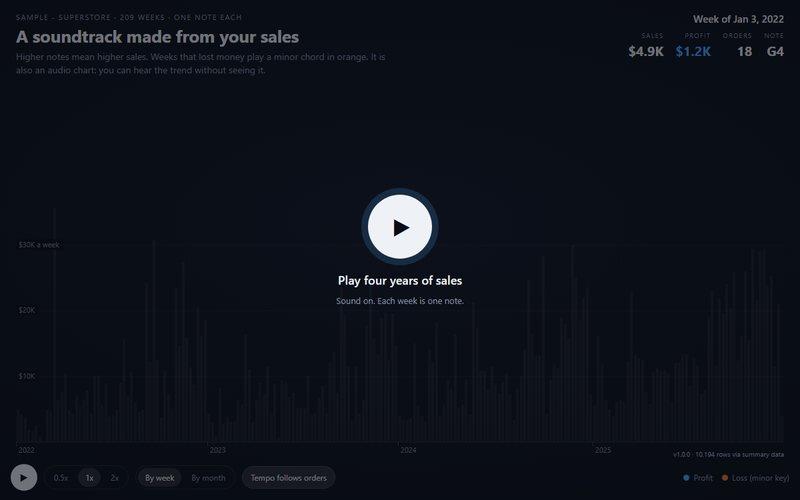
Four years of Superstore sales played as music, one note per week.
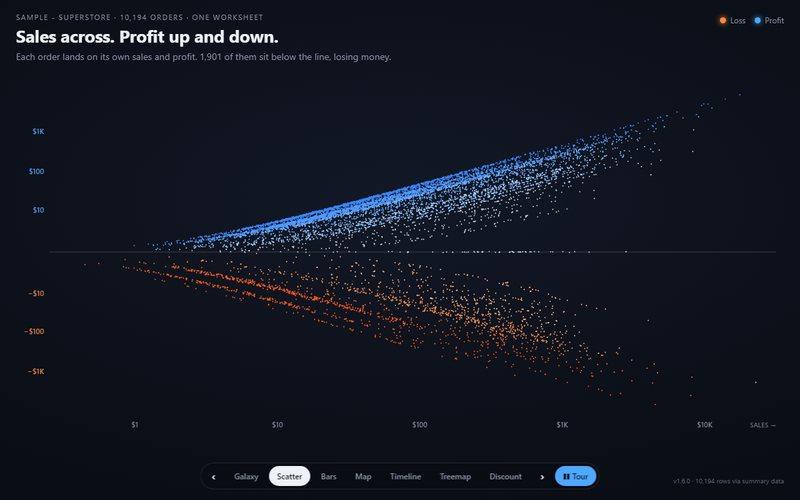
10,194 Superstore orders as particles, morphing between charts.
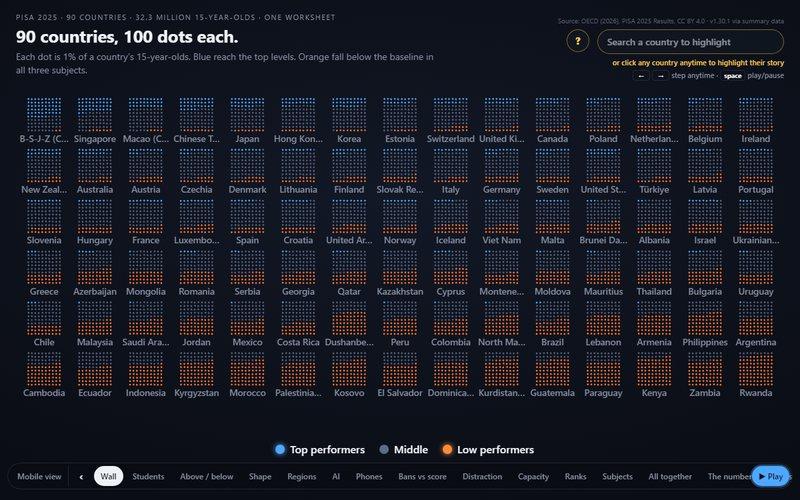
PISA 2025 as particles: 91 countries, 100 dots each. Data: OECD, CC BY 4.0.
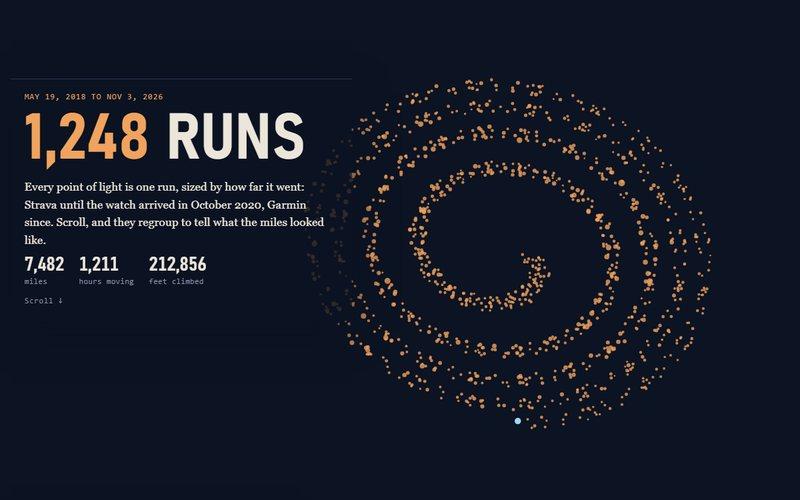
Every run since May 2018 as particles, one dot per run.
Data app or extension? Race to Publish shows the difference.
// Build your own
Three steps from an idea to a dashboard.
- 01
Turn on Packages
In Tableau Cloud, Settings > Packages, check “Allow Packages on this Site” and save. Every data app on the site is listed on that same page.
- 02
Connect Claude to Tableau
Add the Tableau plugin in Claude and connect Tableau Cloud. Its data app skill scaffolds the package for you. You need a role that can publish.
- 03
Describe it, then review it
Say what the app should show. Claude writes it, packages it and publishes it. Open it on Cloud, check what it reads, and iterate.
Setup
Your site configured for data apps, the first ones built on your data and published where people already look.
Training
Your builders learn to make data apps with Claude and Tableau, and to review what AI writes before it ships.
PHI and PII
What an app may read, where it runs and who can see it, worked out with your data and security teams before launch.